Data Reports
2024 vs 2025: Year-Over-Year Mortgage Closing Cost Report
06.24.2026
LodeStar’s 2024 vs. 2025 Year-Over-Year Closing Cost Report analyzes distinct mortgage quotes across all 50 states and the District of Columbia. The expanded deep dive into our eligible dataset makes this the most comprehensive closing cost data report LodeStar has published to date.
The headline finding: average purchase closing costs declined modestly at the national level, falling from $4,661 in 2024 to $4,528 in 2025, a decrease of $133 or 2.9%. The primary driver was a drop in average home prices, which pulled down transfer taxes and other price-linked fees across many markets. However, the national average obscures a split picture: 28 states saw closing costs decrease, while 23 states saw costs rise.
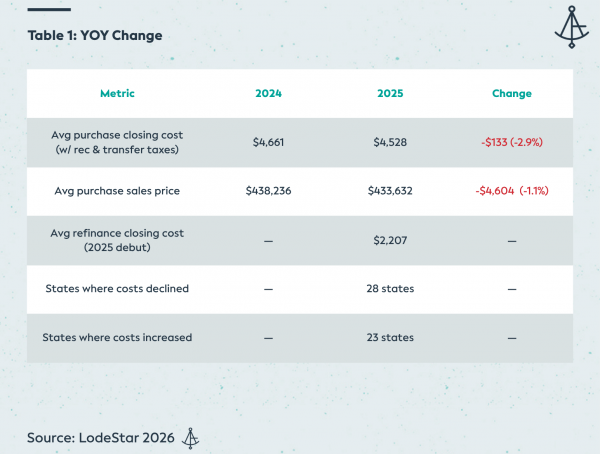
Transfer taxes are calculated as a percentage of the home’s sale price. When average home prices decline, transfer taxes follow. Nationally, average sale prices dropped approximately $4,600 year-over-year, reducing the tax burden in many states. This is not a fee policy change — it is market mechanics at work.
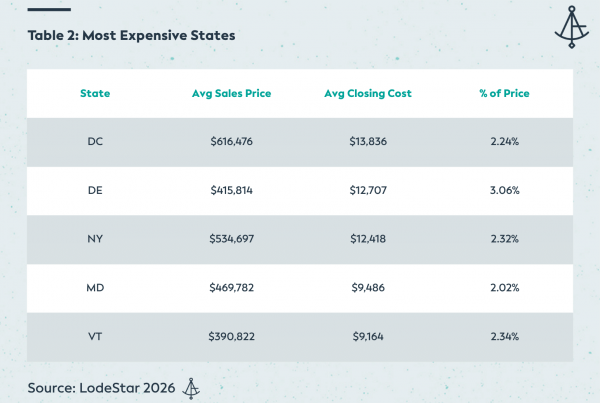
Delaware held its position as the most expensive state for closing costs as a percentage of sales price at 3.06% — a figure driven by its transfer tax structure. The District of Columbia remained the single highest-dollar market at $13,836, despite a significant decline from $17,544 in 2024.
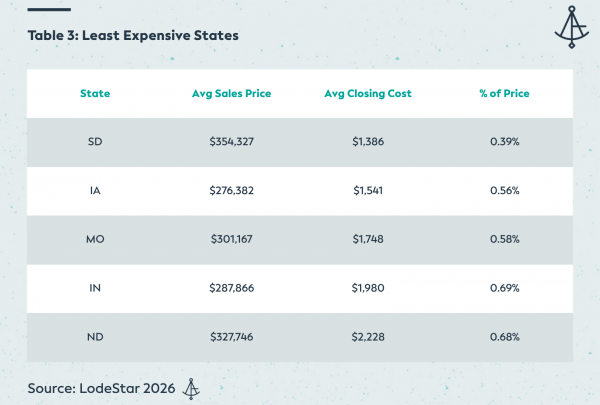
At the other end of the spectrum, the most affordable states for purchase closing costs remained concentrated in the Midwest and Plains, where transfer tax exposure is minimal.
The states with the largest absolute and percentage changes tell the clearest story about how home price movements cascade into closing cost outcomes.
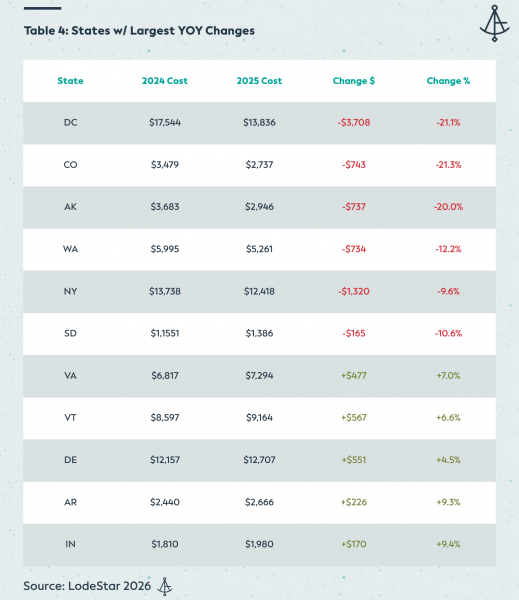
This year’s report spotlights the three states that are the most expensive when it comes to closing costs: the District of Columbia, New York, and Delaware. Each illustrates a distinct mechanism by which closing costs shift over time.
No jurisdiction in our dataset changed more dramatically than D.C. Average purchase closing costs fell from $17,544 to $13,836 — a $3,708 decline. The cause is straightforward: the average purchase price in D.C. fell by approximately $119,000, from $735,243 to $616,476. Since D.C. imposes one of the highest transfer tax rates in the country, a six-figure drop in sale price produces an outsized reduction in the tax component of closing costs.
It is worth noting that even after this decline, D.C. remains the highest-dollar closing cost jurisdiction in the country and the second-highest as a percentage of sale price (2.24%). The underlying fee structure has not changed — only the home prices driving it have.
D.C.’s transfer tax is among the steepest in the nation. A ~$119,000 drop in average sale price directly drove a ~$3,700 reduction in total closing costs. Title and lender fees (the cost without recording and transfer taxes) fell only from $5,689 to $4,411 — a much more modest shift.
New York’s average purchase closing costs declined from $13,738 to $12,418. As in D.C., lower average home prices ($557,130 → $534,697) account for much of the change. New York’s transfer tax is price-linked, so the $22,000 price decline contributed to lower total fees.
New York also offers the most striking illustration of why refinance transactions carry dramatically different cost profiles. The state’s mortgage recording tax is assessed on loan amount, meaning it applies in full on refinance transactions — even though there is no property sale. As a result, New York’s average refinance closing cost in 2025 was $10,553, compared to a national average of $2,207. For every refinancing borrower in New York, the mortgage recording tax adds thousands of dollars.
Average refi closing cost nationally: $2,207. Average refi closing cost in New York: $10,553. The difference is almost entirely explained by New York’s mortgage recording tax, which applies to refinances at the same rate as purchases.
Delaware is the counterpoint story. While most high-transfer-tax states saw costs fall as home prices softened, Delaware’s average purchase price rose modestly, from $406,326 to $415,814. That $9,488 increase compounded through Delaware’s aggressive transfer tax structure, pushing average closing costs from $12,157 to $12,707.
Delaware remains the most expensive state in the country as a percentage of sales price at 3.06% — a distinction it has held consistently. Buyers in Delaware can expect to pay roughly one dollar in closing costs for every $33 of purchase price.
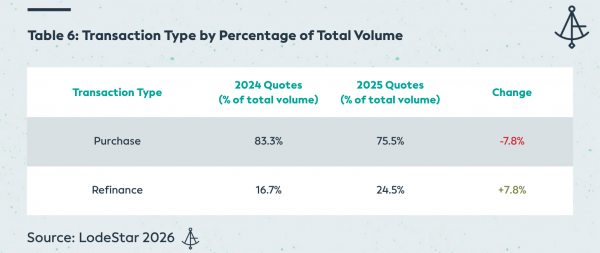
Building on LodeStar’s inaugural refinance report published in 2025 (featuring data for 2024), this year’s eligible dataset indicates a growth of 7.8% in refinance quoting among LodeStar clients — reflecting increased activity as rate conditions shifted.
The national average refinance closing cost was $2,207 — roughly half the average purchase closing cost. This differential is expected: refinances do not involve a property transfer, so transfer taxes typically do not apply, and owner’s title insurance is not required. What remains are lender fees, title search, recording fees, and applicable endorsements.
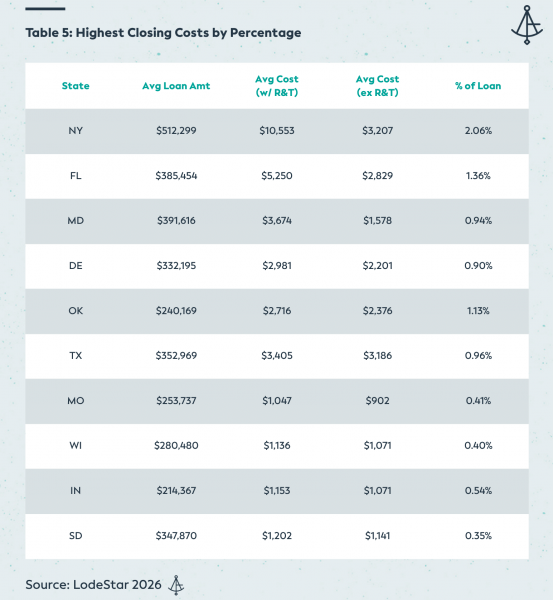
Florida stands out as a refinance outlier after New York, with average refi costs of $5,250 — more than double the national average. Florida does not have a traditional transfer tax in the same sense as New York, but its documentary stamp tax applies to the new note amount on refinances, creating a meaningful cost burden for homeowners seeking to refinance. This is a distinction worth monitoring as rate cycles play out.
Beginning with this report cycle, LodeStar is tracking a previously unmeasured dimension of closing costs: the degree to which state and municipal recording fees fund non-real estate purposes.
Recording fees are presented to borrowers as costs associated with recording legal instruments. In practice, an increasing number of jurisdictions direct a portion — sometimes the majority — of these fees to non-real estate initiatives such as affordable housing programs, homelessness services, and municipal general funds.
Washington state’s recording fee is approximately $300. Of that amount, roughly $270 is allocated to non-recording purposes — including homelessness assistance funds and other state programs. Borrowers pay this fee as part of closing costs with little visibility into its ultimate destination.
The 2025 dataset indicates changes in the transaction types as a percentage of total loan volume. 75.5% of loan volume was comprised of purchase transactions, compared to 83.3% in 2024 — a 7.8% decrease. 24.5% of loan volume was comprised of refinance transactions, compared to 16.7% in 2024 — a 7.8% increase.
LodeStar’s dataset is drawn from the company’s closing cost calculator platform, which serves mortgage lenders across the United States. Each record represents a distinct quote (not a funded loan), identified by a unique search ID. Where lenders run multiple quotes for the same loan, only distinct transactions are counted.
Closing costs are reported both inclusive and exclusive of recording fees and transfer taxes, as these components are highly jurisdiction-specific and can create misleading cross-state comparisons when included without context. The report presents averages by state; individual market results may vary based on loan amount, property value, transaction type, and title provider selection.
Average figures in this report represent the average of state-level averages and should be interpreted as a benchmark rather than a population-weighted national mean.
Mortgage closing costs are all LodeStar does. From statewide transfer taxes to granular township-level fees, LodeStar makes sure your closing costs are spot-on for every disclosure.
Above all else, LodeStar’s core values are providing CLARITY, COMMUNITY, and CONNECTIVITY throughout the mortgage industry.
With the arrival of TRID, co-founders Jim Paolino and David Spektor saw a need for specialists. Managing closing costs might seem like something simple and easy that you can handle in-house. But as many lenders have learned, the world of closing cost disclosure comes with tons of risk: expensive tolerance cures, frustrating LO errors, and the list goes on. LodeStar acts as your partner in fee management, so you can have one less thing to worry about along the road to close.
Tim Austen
Marketing Content Manager
tausten@lssoftwaresolutions.com
Jim Mark, Quality Control Manager
Ron Carvalho, Director of Data Operations
Tim Austen, Marketing Content Manager
Alayna Gardner, Director of Revenue
The national average total closing costs for a refinance mortgage transaction were $2,207. This is an average of 0.67% of the refinance loan amount.
Closing costs as a percentage of sales price hovers around 0.5% to 3%, with an average percentage of 1.04% and a median of 0.85%. Just like in 2025, Delaware leads the pack at a whopping 3.06% of the sales price.